
+- T0rrentinvites - #1 To Buy, Trade, Sell Or Find Free Tracker Invites! (https://t0rrentinvites.com)
+-- Forum: Other Discussions (https://t0rrentinvites.com/forumdisplay.php?fid=30)
+--- Forum: Crypto World News (https://t0rrentinvites.com/forumdisplay.php?fid=48)
+--- Thread: Solana Price Prediction: SOL Faces $125 Test After Breakout (/showthread.php?tid=15526)
Solana Price Prediction: SOL Faces $125 Test After Breakout - TheSeller - 05-24-2026
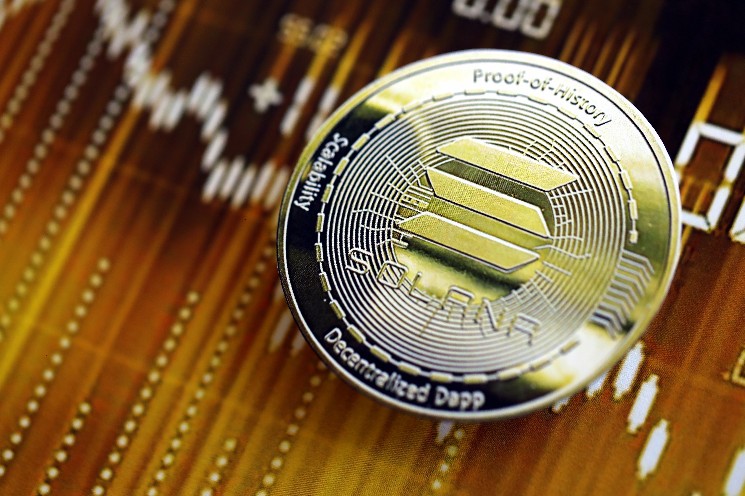
Solana is trading between two clear chart signals, with one setup showing weak corrective rallies and another pointing to a possible breakout retest. $SOL needs to hold the $84 to $85 area and clear nearby resistance before the $125 target becomes stronger.
Solana Price Struggles as $SOL Rejects Corrective Rallies
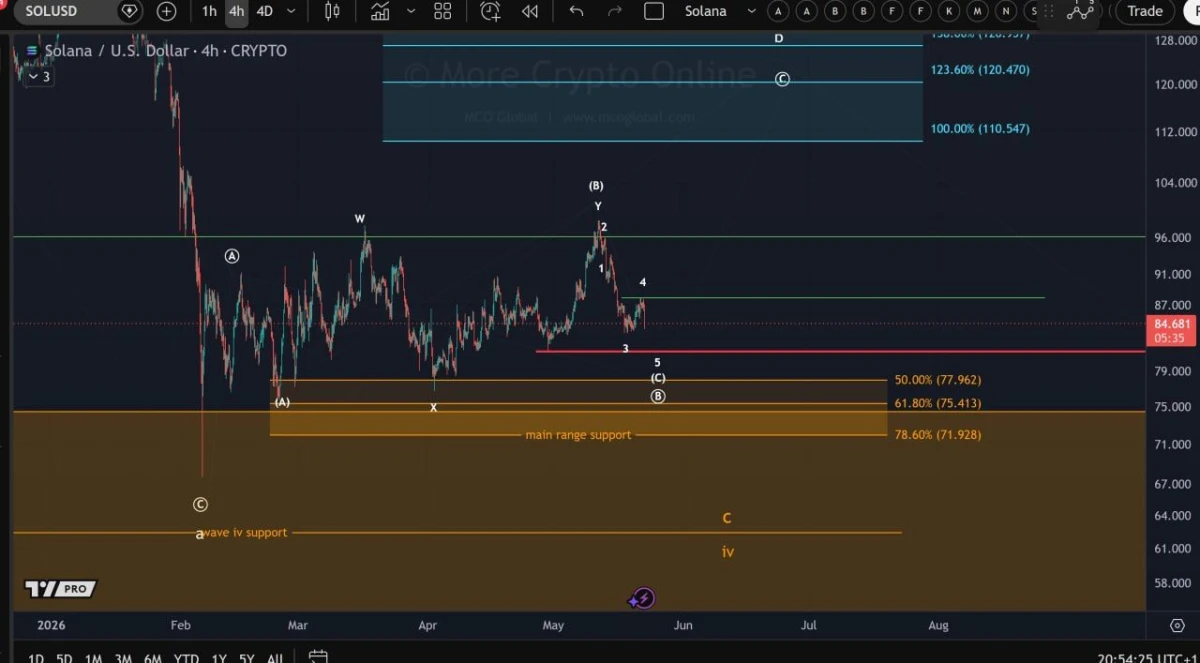
Solana traded near $84.68 on the 4 hour chart after another rejection from a short term recovery move. The chart shared by More Crypto Online on X shows $SOL failing to hold above the nearby resistance zone around $87.
The main issue is clear. $SOL keeps bouncing, but each rally loses strength before price reaches the larger resistance near $95 to $96. That area acted as a major rejection zone earlier in May. As long as $SOL stays below it, the recovery structure remains weak.
$SOL Corrective Rally Rejection Chart. Source: More Crypto Online on X
The nearest support sits around $82, marked by the red horizontal line. If Solana loses that level, the chart points back toward the main range support area between $77.96, $75.41, and $71.92. These levels match the 50%, 61.8%, and 78.6% Fibonacci retracement marks shown on the chart.
The orange support zone matters because it has held previous downside moves. A deeper move into that area would not fully break the larger range, but it would show that buyers still lack control.
For the upside case, $SOL needs a clean move above $87 first. Then, the more important level remains $95 to $96. A break above that zone would weaken the bearish setup and open room for a stronger move toward the higher Fibonacci extension area near $110, $120, and $128.
For now, the chart supports More Crypto Online’s point. $SOL has not shown enough strength after corrective rallies. The price remains stuck between short term resistance and the main support range, with $82 as the first level to watch.
Solana Price Breakout Keeps $125 Target in View
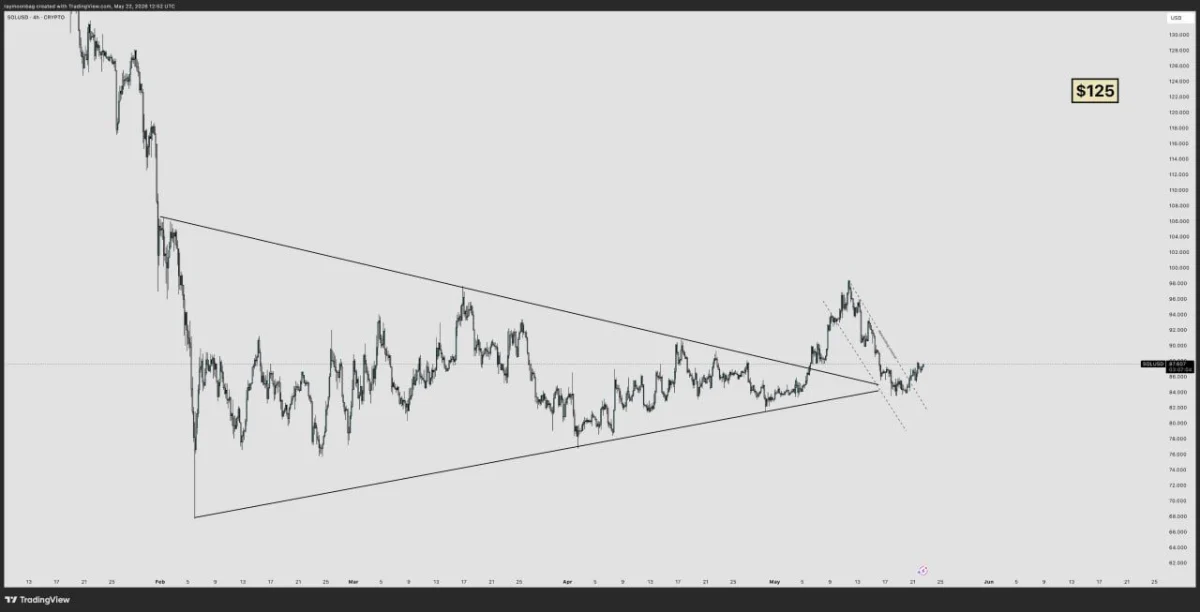
Solana traded near $87.60 on the 4 hour chart after breaking out from a large triangle structure. The chart shared by ray on X shows $SOL moving above the long descending resistance line that capped price action since February.
The breakout is the main point here. $SOL spent months moving inside the triangle, with lower highs and higher lows tightening the range. After the breakout in May, price rallied toward $98, then pulled back into the former breakout area.
$SOL Triangle Breakout Chart. Source: ray on X
That pullback looks like a retest. $SOL held near the $84 to $85 zone and started moving higher again. This keeps the bullish structure alive as long as price does not lose that support.
The first resistance now sits around $90 to $92. If $SOL clears that area, the next major level is the previous local high near $98. A clean move above $98 would strengthen the case for a larger rally.
The chart’s upside target is $125. That level sits above the previous breakdown zone and marks the main target shown on the chart.
However, $SOL still needs confirmation. If price falls below $84, the breakout retest weakens. A deeper drop could send $SOL back toward $80 or even the lower range near $76.
For now, the chart shows a stronger setup than the previous one. $SOL has broken the triangle, retested support, and started to recover. The $125 target stays active while price holds above the breakout zone.