
+- T0rrentinvites - #1 To Buy, Trade, Sell Or Find Free Tracker Invites! (https://t0rrentinvites.com)
+-- Forum: Other Discussions (https://t0rrentinvites.com/forumdisplay.php?fid=30)
+--- Forum: Crypto World News (https://t0rrentinvites.com/forumdisplay.php?fid=48)
+--- Thread: Sui traders eye range lows at $0.70 as oversold RSI signals potential buying zone (/showthread.php?tid=18475)
Sui traders eye range lows at $0.70 as oversold RSI signals potential buying zone - TheSeller - 07-25-2026

Sui [$SUI] faced a 5% price drawdown in the past 24 hours, with a 9.6% uptick in daily trading volume. This was worrisome as it suggested a short-term increase in selling pressure.
The rest of the crypto market has faced losses over the past day, too. Bitcoin [BTC] and Ethereum [ETH] were down 1.05% and 1.14%, respectively. Compared to these market leaders, Sui was underperforming in the short-term.
Why the Sui downturn is surprising
Coinbase announced that $SUI can be staked directly on the exchange. Staking rewards would directly accumulate to the user’s account. It offered an easy, effortless way of earning rewards.
The rest of the crypto market has faced losses over the past day, too. Bitcoin [BTC] and Ethereum [ETH] were down 1.05% and 1.14%, respectively. Compared to these market leaders, Sui was underperforming in the short-term.
Why the Sui downturn is surprising
Coinbase announced that $SUI can be staked directly on the exchange. Staking rewards would directly accumulate to the user’s account. It offered an easy, effortless way of earning rewards.
Source: Ted on X
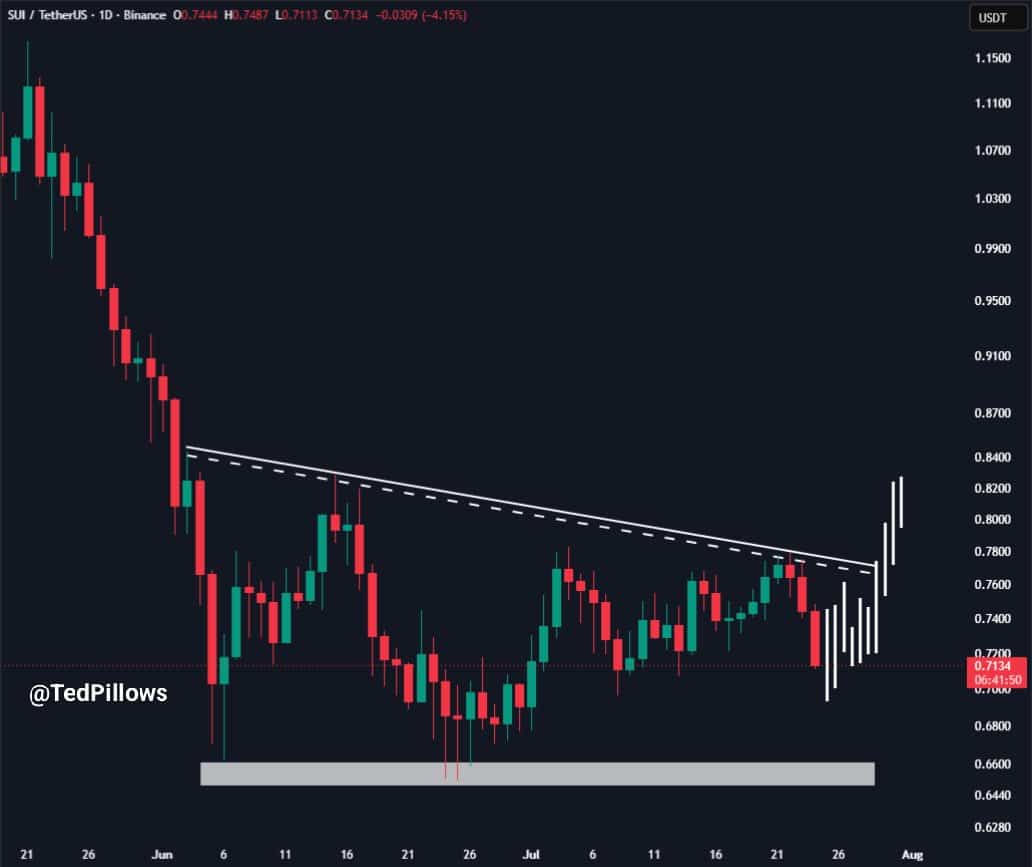
Trader Ted noted that the bullish catalyst could help the altcoin break past the descending trendline resistance in place since early June. The token has defended the $0.66 support zone well so far.
Some more consolidation followed by a bullish breakout was a viable scenario, the trader wrote.
Trader Ted noted that the bullish catalyst could help the altcoin break past the descending trendline resistance in place since early June. The token has defended the $0.66 support zone well so far.
Some more consolidation followed by a bullish breakout was a viable scenario, the trader wrote.
Source: $SUI/$USDT on TradingView
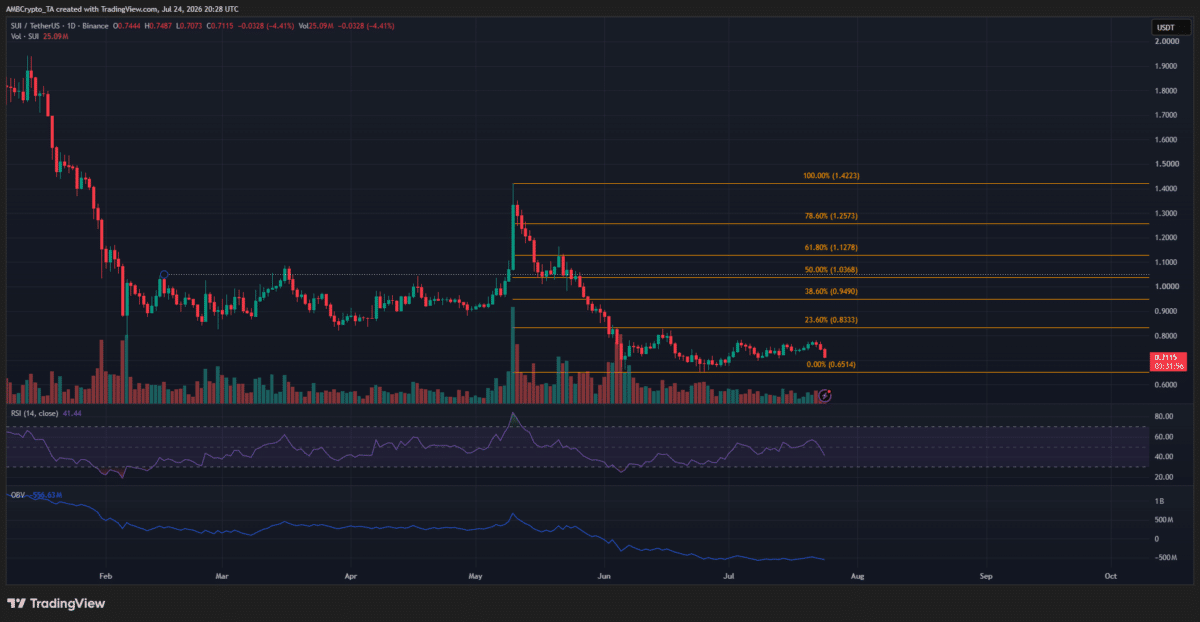
The swing low at $0.65, made in June, marked the swing structure’s low. The RSI on the 1-day timeframe recently climbed above neutral 50, but the losses of the past three days sent the momentum indicator tumbling once more.
The OBV was in a downtrend, although the selling pressure has eased in July.
A pullback, in the form of a rally toward $1.12-$1.25, the Fibonacci golden pocket, was technically possible. However, it was far from playing out in reality.
Traders’ call to action- Wait
Source: $SUI/$USDT on TradingView
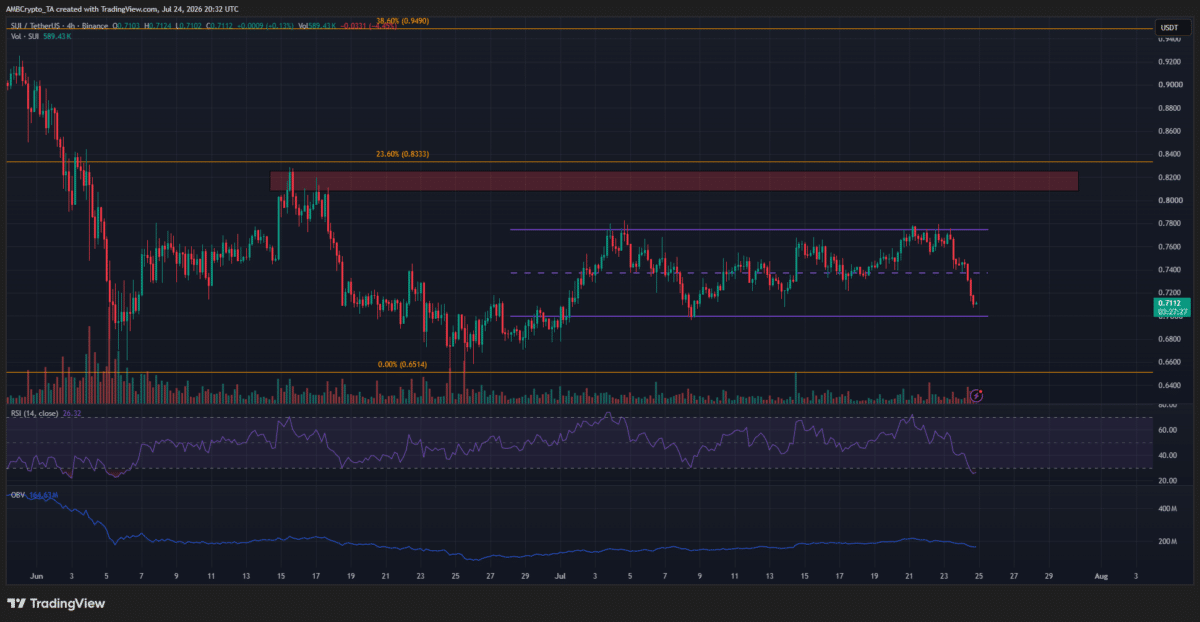
In July, $SUI has been trading within the $0.70-$0.77 range. Traders can look to trade the token within this range. The RSI on the 4-hour chart was in oversold territory as the token approached the range lows.
While this can be a buying opportunity, a breakout past the $0.82 local resistance zone would be a stronger buy signal for swing traders. Similarly, a breakdown below $0.65 would signal that the next impulse bearish price move was imminent.