
+- T0rrentinvites - #1 To Buy, Trade, Sell Or Find Free Tracker Invites! (https://t0rrentinvites.com)
+-- Forum: Other Discussions (https://t0rrentinvites.com/forumdisplay.php?fid=30)
+--- Forum: Crypto World News (https://t0rrentinvites.com/forumdisplay.php?fid=48)
+--- Thread: Ethereum Classic rallies as altcoin rotation returns – What’s next for ETC? (/showthread.php?tid=20316)
Ethereum Classic rallies as altcoin rotation returns – What’s next for ETC? - TheSeller - 09-10-2026

Ethereum Classic [$ETC] attracted fresh buying as capital appeared to rotate toward older Layer-1 networks. The shift aligned with CoinMarketCap’s Altcoin Season Index, which climbed to 48 over the past month.
At press time, $ETC had jumped 10% over 24 hours to $8.74. Trading Volume also climbed 150% to $113.63 million.
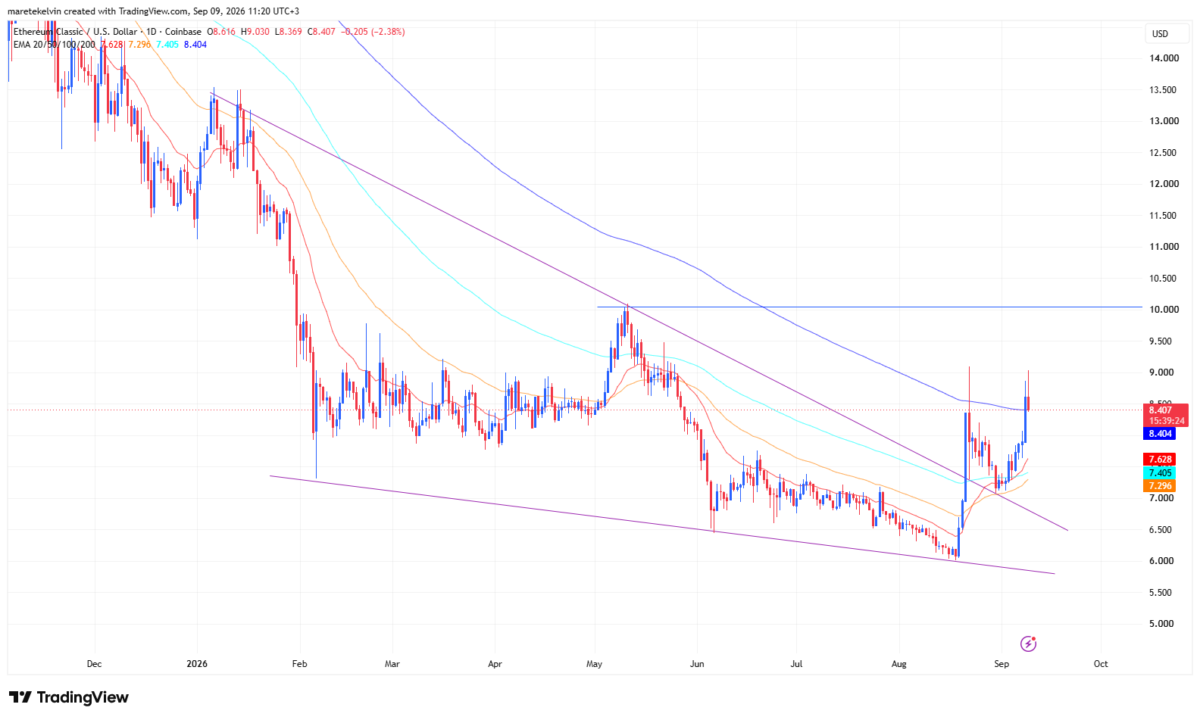
On the daily chart, $ETC had reclaimed its key EMAs, shifting its short-term technical structure toward buyers. The move extended the bullish momentum that emerged after $ETC retested its pennant last week.
At press time, $ETC had jumped 10% over 24 hours to $8.74. Trading Volume also climbed 150% to $113.63 million.
On the daily chart, $ETC had reclaimed its key EMAs, shifting its short-term technical structure toward buyers. The move extended the bullish momentum that emerged after $ETC retested its pennant last week.
Source: TradingView
Can $ETC sustain its 10% rally?
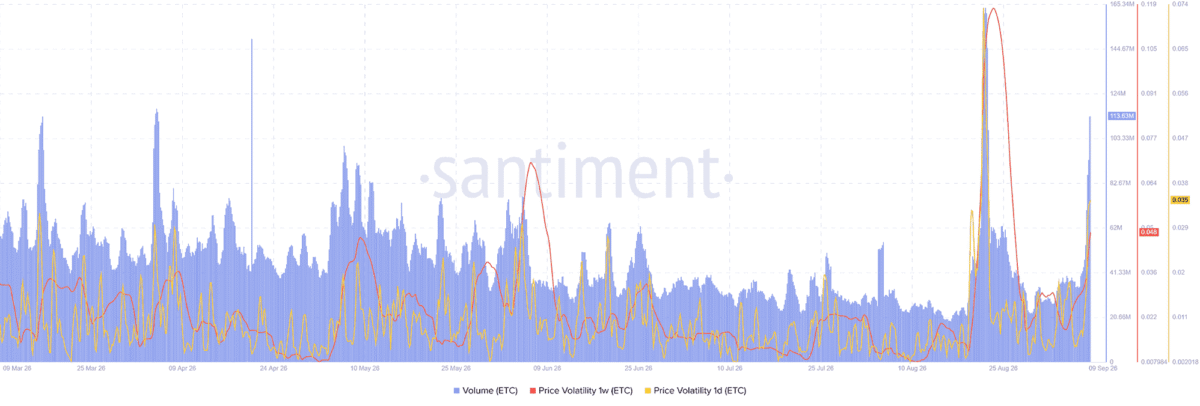
The 150% Trading Volume increase showed much stronger participation than during earlier stages of the recovery.
If activity remains elevated, $ETC could gain enough momentum to challenge its next major resistance. At the same time, daily and weekly Price Volatility rose sharply over 48 hours.
This could accelerate $ETC’s move along the current trend. However, rising Price Volatility also increased the risk of a sudden reversal.
Can $ETC sustain its 10% rally?
The 150% Trading Volume increase showed much stronger participation than during earlier stages of the recovery.
If activity remains elevated, $ETC could gain enough momentum to challenge its next major resistance. At the same time, daily and weekly Price Volatility rose sharply over 48 hours.
This could accelerate $ETC’s move along the current trend. However, rising Price Volatility also increased the risk of a sudden reversal.
Source: Santiment
Can Ethereum Classic break $10?
The next major test sits near the $10 swing high, roughly 14% above $ETC’s press-time price.
Clearing this level could extend the rebound and confirm a broader bullish structure after the pennant breakout. $ETC also remained above its key EMAs, supporting the improving short-term outlook.
Even so, Price Volatility measures movement intensity rather than direction. A rejection near $10 could send $ETC back toward its EMA support after the breakout attempt.
By contrast, a decisive close above $10 with elevated Trading Volume could give the rally another leg. This leaves $10 as the line between a strong recovery and a potentially larger trend.
Can Ethereum Classic break $10?
The next major test sits near the $10 swing high, roughly 14% above $ETC’s press-time price.
Clearing this level could extend the rebound and confirm a broader bullish structure after the pennant breakout. $ETC also remained above its key EMAs, supporting the improving short-term outlook.
Even so, Price Volatility measures movement intensity rather than direction. A rejection near $10 could send $ETC back toward its EMA support after the breakout attempt.
By contrast, a decisive close above $10 with elevated Trading Volume could give the rally another leg. This leaves $10 as the line between a strong recovery and a potentially larger trend.