
+- T0rrentinvites - #1 To Buy, Trade, Sell Or Find Free Tracker Invites! (https://t0rrentinvites.com)
+-- Forum: Other Discussions (https://t0rrentinvites.com/forumdisplay.php?fid=30)
+--- Forum: Crypto World News (https://t0rrentinvites.com/forumdisplay.php?fid=48)
+--- Thread: XRP Tests 200-Day SMA as 2023 Bounce Maps $3.20 Scenario (/showthread.php?tid=21067)
XRP Tests 200-Day SMA as 2023 Bounce Maps $3.20 Scenario - TheSeller - 10-16-2026
$XRP is testing its 200-day SMA zone as its 2023 rebound offers a historical comparison that would map a recovery toward roughly $3.20.
$XRP has returned to the same long-term moving-average area that helped establish a recovery base in 2023.
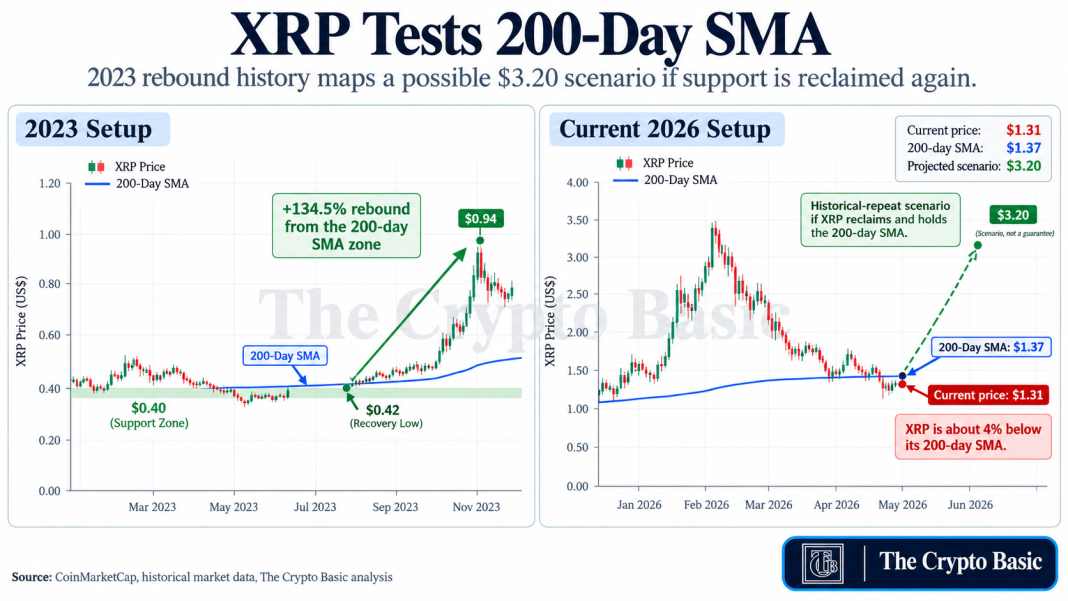
With $XRP now trading near $1.31 and its 200-day simple moving average around $1.37, the immediate test is whether buyers can reclaim the trend line and repeat part of the earlier rebound.
$XRP has returned to the same long-term moving-average area that helped establish a recovery base in 2023.
With $XRP now trading near $1.31 and its 200-day simple moving average around $1.37, the immediate test is whether buyers can reclaim the trend line and repeat part of the earlier rebound.
$XRP 200 Day SMA Rebound Scenario
$XRP is currently about 4% below the 200-day SMA. That makes the present setup slightly weaker than a clean support test from above: price first needs to recover the average before it can attempt to turn it back into support.
$XRP Defended the $0.40 Area in 2023
In March 2023, $XRP pushed above its 200-day SMA, which stood near $0.40 at the time. Price later returned toward the same broader moving-average area in May, briefly slipping below it before recovering.
Historical data places $XRP’s May low near $0.4217, while contemporary analysis highlighted $0.40 as the main support zone.
That defense eventually preceded a much larger move. $XRP reached approximately $0.938 on July 13, representing an increase of roughly 134.5% from $0.40.
The strongest leg of that rally followed the court ruling in the SEC’s case against Ripple, so the 200-day average was not the only driver. It acted as a technical foundation before a separate catalyst accelerated the move.
What a Similar $XRP Bounce Would Mean in 2026
The current 200-day SMA is near $1.3665. Applying the same 134.5% increase recorded from the 2023 support area would produce an $XRP price of approximately $3.20.
That is a historical-repeat calculation rather than a fixed forecast.
From the current price near $1.31, reaching $3.20 would require an advance of about 145%.
The resulting level would still sit below $XRP’s 2025 peak near $3.66, meaning the scenario would represent a substantial recovery without necessarily producing a new record.
$XRP Must First Reclaim the 200-Day SMA
The 2023 comparison only becomes useful if $XRP recovers above the 200-day SMA and holds it.
A move back above roughly $1.37, followed by a successful retest, would show that buyers are again defending the longer-term trend measure. That would give $XRP a base from which to attempt a broader recovery.
Continued trading below the average would weaken the comparison. Instead of acting as support, the 200-day SMA would become overhead resistance, leaving $XRP vulnerable to further downside before any larger bounce develops.
The current setup is therefore not yet at the projected stage. $XRP first needs to reclaim its 200-day SMA. If it then reproduced the scale of its 2023 recovery from that moving-average zone, the proportional target would sit near $3.20.
$XRP is currently about 4% below the 200-day SMA. That makes the present setup slightly weaker than a clean support test from above: price first needs to recover the average before it can attempt to turn it back into support.
$XRP Defended the $0.40 Area in 2023
In March 2023, $XRP pushed above its 200-day SMA, which stood near $0.40 at the time. Price later returned toward the same broader moving-average area in May, briefly slipping below it before recovering.
Historical data places $XRP’s May low near $0.4217, while contemporary analysis highlighted $0.40 as the main support zone.
That defense eventually preceded a much larger move. $XRP reached approximately $0.938 on July 13, representing an increase of roughly 134.5% from $0.40.
The strongest leg of that rally followed the court ruling in the SEC’s case against Ripple, so the 200-day average was not the only driver. It acted as a technical foundation before a separate catalyst accelerated the move.
What a Similar $XRP Bounce Would Mean in 2026
The current 200-day SMA is near $1.3665. Applying the same 134.5% increase recorded from the 2023 support area would produce an $XRP price of approximately $3.20.
That is a historical-repeat calculation rather than a fixed forecast.
From the current price near $1.31, reaching $3.20 would require an advance of about 145%.
The resulting level would still sit below $XRP’s 2025 peak near $3.66, meaning the scenario would represent a substantial recovery without necessarily producing a new record.
$XRP Must First Reclaim the 200-Day SMA
The 2023 comparison only becomes useful if $XRP recovers above the 200-day SMA and holds it.
A move back above roughly $1.37, followed by a successful retest, would show that buyers are again defending the longer-term trend measure. That would give $XRP a base from which to attempt a broader recovery.
Continued trading below the average would weaken the comparison. Instead of acting as support, the 200-day SMA would become overhead resistance, leaving $XRP vulnerable to further downside before any larger bounce develops.
The current setup is therefore not yet at the projected stage. $XRP first needs to reclaim its 200-day SMA. If it then reproduced the scale of its 2023 recovery from that moving-average zone, the proportional target would sit near $3.20.