
+- T0rrentinvites - #1 To Buy, Trade, Sell Or Find Free Tracker Invites! (https://t0rrentinvites.com)
+-- Forum: Other Discussions (https://t0rrentinvites.com/forumdisplay.php?fid=30)
+--- Forum: Crypto World News (https://t0rrentinvites.com/forumdisplay.php?fid=48)
+--- Thread: Bitcoin Price Analysis: BTC Risks Dropping Below $79K After Second-Week High Sweep (/showthread.php?tid=21488)
Bitcoin Price Analysis: BTC Risks Dropping Below $79K After Second-Week High Sweep - TheSeller - 10-24-2026

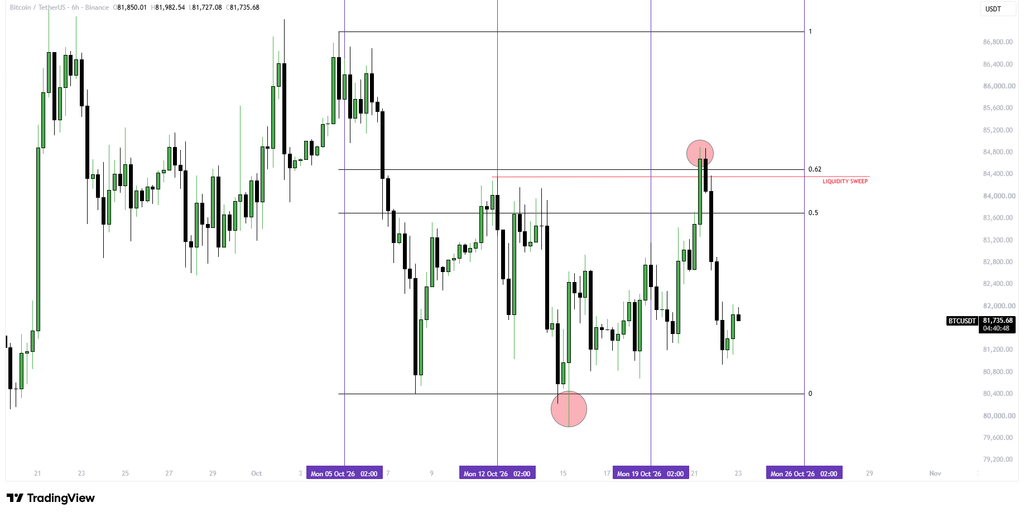
Bitcoin fell toward $81,736 after reaching $84,800, reversing above October’s second-week high near $84,400. This $BTC retreat consequently raised the risk of a failed breakout, exposing the token to potential downside risks below $79,000.
Price Level Technical Significance
$84,400–$84,800 Swept resistance zone
$83,700 Monthly equilibrium
$81,000–$80,400 Immediate support
$79,800–$79,600 Downside liquidity zone
$77,600 Lower valuation reference
Bitcoin Sweeps $84,400 Second-Week High, Raising Sub-$79K Risk
Bitcoin’s brief move above the October 12–18 high has failed to hold, leaving the cryptocurrency vulnerable to further losses. The Binance six-hour $BTC/USDT chart places the previous week’s resistance between $84,000 and $84,400, a zone buyers briefly cleared before prices retreated below $83,700.
The reversal points to a possible buy-side liquidity sweep rather than a sustained breakout, although the chart alone cannot confirm whether liquidations drove the decline. Weakness in technology stocks and rising oil prices also weighed on broader risk sentiment.
Third-Week Close Below $83,700 Would Reinforce Failed Breakout
Attention now turns to the October 19–25 weekly close. With the candle still forming, a finish back inside the preceding week’s range, particularly below $83,700, would add weight to the failed-breakout scenario.
Price Level Technical Significance
$84,400–$84,800 Swept resistance zone
$83,700 Monthly equilibrium
$81,000–$80,400 Immediate support
$79,800–$79,600 Downside liquidity zone
$77,600 Lower valuation reference
Bitcoin Sweeps $84,400 Second-Week High, Raising Sub-$79K Risk
Bitcoin’s brief move above the October 12–18 high has failed to hold, leaving the cryptocurrency vulnerable to further losses. The Binance six-hour $BTC/USDT chart places the previous week’s resistance between $84,000 and $84,400, a zone buyers briefly cleared before prices retreated below $83,700.
The reversal points to a possible buy-side liquidity sweep rather than a sustained breakout, although the chart alone cannot confirm whether liquidations drove the decline. Weakness in technology stocks and rising oil prices also weighed on broader risk sentiment.
Third-Week Close Below $83,700 Would Reinforce Failed Breakout
Attention now turns to the October 19–25 weekly close. With the candle still forming, a finish back inside the preceding week’s range, particularly below $83,700, would add weight to the failed-breakout scenario.
Source: TradingView
The immediate downside levels sit near $81,000 and $80,400. Losing $79,800 would bring $79,600 into focus, with a deeper retreat potentially taking Bitcoin below $79,000.
Glassnode’s October 21 analysis adds context to that risk. The firm identified renewed bids around $80,000 but also flagged a liquidation cluster near $79,600, leaving both levels important if selling intensifies.
Follow us on X for real-time crypto updates.
Fourth-Week Outlook Hinges on $83,700 Monthly Equilibrium
Bitcoin also remains below the chart’s $83,700 monthly midpoint. Unless buyers recover that level, the October 26–November 1 trading week could see further downside pressure. Glassnode also identified $77,600 as a lower on-chain valuation reference worth watching if support gives way.
That level, however, should not be treated as a firm downside target. Meanwhile, institutional buying has not entirely faded. U.S. spot Bitcoin ETFs recorded $528.4 million in net inflows on October 21, according to SoSoValue, despite the recent market weakness.
A move back above $83,700 would ease some of the pressure on Bitcoin buyers. Still, the bearish setup would remain intact unless prices climb above $84,400–$84,800 and hold there.
The Federal Reserve’s October 28 policy decision is another event traders will be watching. It could bring renewed volatility to a market already under pressure as Bitcoin heads into the final trading week of October.
Bitcoin Weekly Price Scenarios
Scenario Confirmation Potential Outcome
Bearish Break below $79,800. Sub-$79,000 risk
Neutral Hold $80,400–$83,700 Range consolidation
Bullish Reclaim $84,400–$84,800 Bearish setup weakens.
Bearish Case
A weekly close below $83,700, followed by declining support, would strengthen the downside outlook.
Recovery Case
However, sustained acceptance above $84,800 would challenge the failed-breakout interpretation.
FAQs
1. Can Bitcoin Fall Below $79,000?
Yes. A sustained breakdown below $81,000, $80,400, and $79,800 could expose Bitcoin to further losses beneath $79,000.
2. Why Does The Second-Week High Matter?
The $84,400 high was a key resistance area where buy-side liquidity had built up. Bitcoin briefly crossed it but failed to hold those gains.
3. What Would An Inside-Range Weekly Close Mean?
A weekly close below $83,700 would strengthen the failed-breakout interpretation, indicating buyers could not sustain momentum above the second-week high.
4. Is $79,800 Bitcoin’s Next Downside Target?
Not immediately. Bitcoin still has support around $81,000 and $80,400. If both levels give way, $79,800 becomes the next area to watch.
5. Could $BTC Turn Bearish Next Week?
Yes. Sustained trading below the $83,700 monthly equilibrium during October’s fourth week would reinforce bearish conditions and increase downside risks.
Subscribe to our YouTube channel for the latest crypto news.
Related: Bitcoin Rebounds Above $81,500 After Tech-Led Sell-Off — Is $80K Support Holding?
The immediate downside levels sit near $81,000 and $80,400. Losing $79,800 would bring $79,600 into focus, with a deeper retreat potentially taking Bitcoin below $79,000.
Glassnode’s October 21 analysis adds context to that risk. The firm identified renewed bids around $80,000 but also flagged a liquidation cluster near $79,600, leaving both levels important if selling intensifies.
Follow us on X for real-time crypto updates.
Fourth-Week Outlook Hinges on $83,700 Monthly Equilibrium
Bitcoin also remains below the chart’s $83,700 monthly midpoint. Unless buyers recover that level, the October 26–November 1 trading week could see further downside pressure. Glassnode also identified $77,600 as a lower on-chain valuation reference worth watching if support gives way.
That level, however, should not be treated as a firm downside target. Meanwhile, institutional buying has not entirely faded. U.S. spot Bitcoin ETFs recorded $528.4 million in net inflows on October 21, according to SoSoValue, despite the recent market weakness.
A move back above $83,700 would ease some of the pressure on Bitcoin buyers. Still, the bearish setup would remain intact unless prices climb above $84,400–$84,800 and hold there.
The Federal Reserve’s October 28 policy decision is another event traders will be watching. It could bring renewed volatility to a market already under pressure as Bitcoin heads into the final trading week of October.
Bitcoin Weekly Price Scenarios
Scenario Confirmation Potential Outcome
Bearish Break below $79,800. Sub-$79,000 risk
Neutral Hold $80,400–$83,700 Range consolidation
Bullish Reclaim $84,400–$84,800 Bearish setup weakens.
Bearish Case
A weekly close below $83,700, followed by declining support, would strengthen the downside outlook.
Recovery Case
However, sustained acceptance above $84,800 would challenge the failed-breakout interpretation.
FAQs
1. Can Bitcoin Fall Below $79,000?
Yes. A sustained breakdown below $81,000, $80,400, and $79,800 could expose Bitcoin to further losses beneath $79,000.
2. Why Does The Second-Week High Matter?
The $84,400 high was a key resistance area where buy-side liquidity had built up. Bitcoin briefly crossed it but failed to hold those gains.
3. What Would An Inside-Range Weekly Close Mean?
A weekly close below $83,700 would strengthen the failed-breakout interpretation, indicating buyers could not sustain momentum above the second-week high.
4. Is $79,800 Bitcoin’s Next Downside Target?
Not immediately. Bitcoin still has support around $81,000 and $80,400. If both levels give way, $79,800 becomes the next area to watch.
5. Could $BTC Turn Bearish Next Week?
Yes. Sustained trading below the $83,700 monthly equilibrium during October’s fourth week would reinforce bearish conditions and increase downside risks.
Subscribe to our YouTube channel for the latest crypto news.
Related: Bitcoin Rebounds Above $81,500 After Tech-Led Sell-Off — Is $80K Support Holding?