










 07-19-2026, 16:33


 I Am Watching You!





Bitcoin Faces $65,500 Wall as Daily Chart Volume Cools After Mid-July Rebound

1-Hour Chart: Tight Range Holds as Volume Fades
The 1-hour chart shows bitcoin locked in a narrow consolidation after recovering from roughly $62,470 to $64,347.
Price has printed a series of small-bodied candles between $63,900 and $64,000, a pattern that signals neither buyers nor sellers currently hold control of the short-term trend. Trading volume has declined steadily through the consolidation, a condition that often precedes a sharper directional move once it resolves.
The 1-hour chart shows bitcoin locked in a narrow consolidation after recovering from roughly $62,470 to $64,347.
Price has printed a series of small-bodied candles between $63,900 and $64,000, a pattern that signals neither buyers nor sellers currently hold control of the short-term trend. Trading volume has declined steadily through the consolidation, a condition that often precedes a sharper directional move once it resolves.
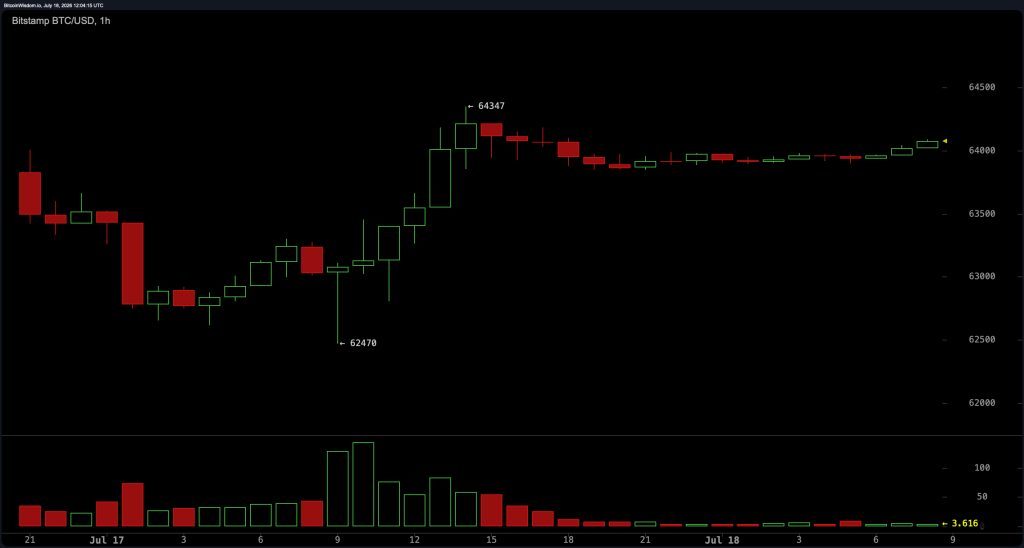
$BTC/USD 1-hour chart via Bitstamp on July 18, 2026.
An hourly close above $64,150 to $64,250 on rising volume would open the door toward $64,350 and then $64,700 to $65,000, while a drop below $63,700 would put the recent gains at risk.
4-Hour Chart: Buyers Defend the Dip
The 4-hour chart remains constructive despite a pullback from a local high of $65,518. Buyers stepped in near $62,700 to $63,000, producing a sharp recovery candle followed by sideways trading around $64,000. The retreat looks orderly rather than impulsive, pointing to profit-taking instead of a trend reversal.
An hourly close above $64,150 to $64,250 on rising volume would open the door toward $64,350 and then $64,700 to $65,000, while a drop below $63,700 would put the recent gains at risk.
4-Hour Chart: Buyers Defend the Dip
The 4-hour chart remains constructive despite a pullback from a local high of $65,518. Buyers stepped in near $62,700 to $63,000, producing a sharp recovery candle followed by sideways trading around $64,000. The retreat looks orderly rather than impulsive, pointing to profit-taking instead of a trend reversal.
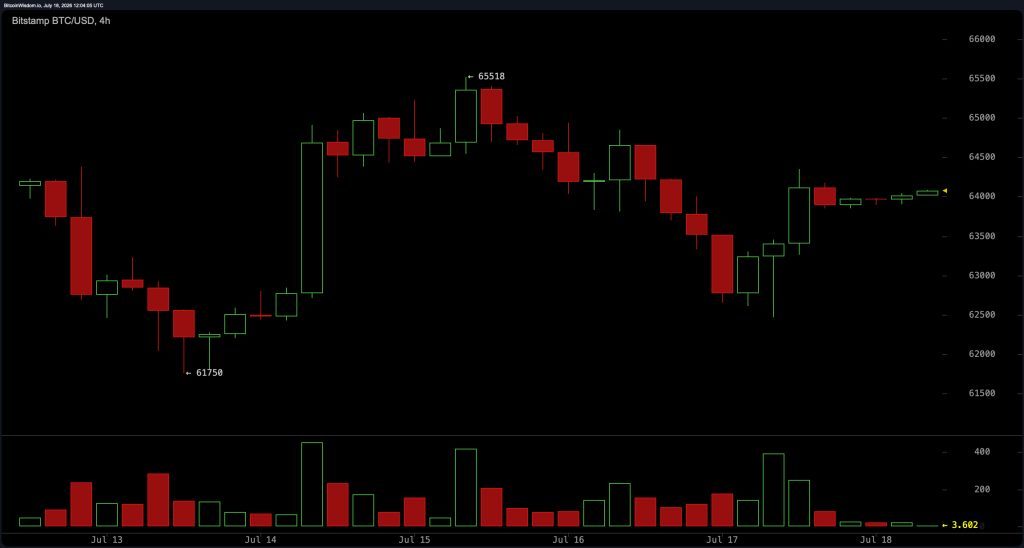
$BTC/USD 4-hour chart via Bitstamp on July 18, 2026.
Support sits at $63,600 and then $63,000 to $62,700, while resistance holds at $64,500 and then $65,500. A close above $64,500 on stronger volume would confirm bullish continuation, but losing $63,600 would likely send the price back toward the $63,000 zone.
Daily Chart: Higher Lows Stay Intact
The daily chart still favors buyers. Bitcoin continues printing higher lows after rebounding from roughly $57,735, and price remains above the broader recovery trend that started in late June. Recent candles show consolidation beneath resistance rather than heavy selling, a pattern that generally favors continuation.
Support sits at $63,600 and then $63,000 to $62,700, while resistance holds at $64,500 and then $65,500. A close above $64,500 on stronger volume would confirm bullish continuation, but losing $63,600 would likely send the price back toward the $63,000 zone.
Daily Chart: Higher Lows Stay Intact
The daily chart still favors buyers. Bitcoin continues printing higher lows after rebounding from roughly $57,735, and price remains above the broader recovery trend that started in late June. Recent candles show consolidation beneath resistance rather than heavy selling, a pattern that generally favors continuation.
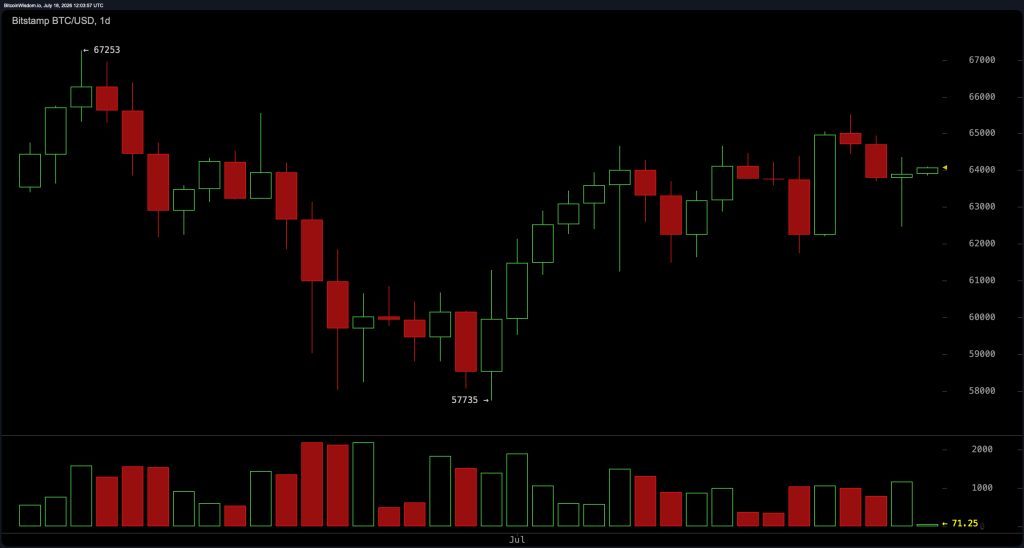
$BTC/USD daily chart via Bitstamp on July 18, 2026.
Daily volume has moderated, suggesting the market is waiting on a fresh catalyst before attempting another breakout. Major support sits at $62,000 to $62,500, with secondary support at $60,000, while resistance holds at $65,000 to $65,500. A close above $65,500 could open a path toward $67,000 and potentially new local highs.
Oscillators Lean Bullish Despite Neutral Readings
Momentum indicators lean bullish even as several readings sit in neutral territory. The relative strength index ( RSI) reads 52, the Stochastic reads 61, the commodity channel index (CCI) reads 63, and the average directional index (ADX) reads 24, all neutral.
Three indicators tilt bullish: the Awesome oscillator (AO) sits at 1,308, the momentum indicator (MOM) sits at 1,664 and the moving average convergence divergence ( MACD) level reads 118. The split between neutral and bullish oscillator readings mirrors the price chart itself, a market building energy inside a range rather than trending hard in either direction.
Moving Averages Send Mixed Signals
Moving averages (MAs) send a mixed message depending on the timeframe. Short-term averages favor buyers: the 10-period exponential moving average (EMA) sits at $63,712, the 10-period simple moving average (SMA) sits at $63,835, and the 20-period, 30-period, and 50-period SMAs all read bullish as well.
Daily volume has moderated, suggesting the market is waiting on a fresh catalyst before attempting another breakout. Major support sits at $62,000 to $62,500, with secondary support at $60,000, while resistance holds at $65,000 to $65,500. A close above $65,500 could open a path toward $67,000 and potentially new local highs.
Oscillators Lean Bullish Despite Neutral Readings
Momentum indicators lean bullish even as several readings sit in neutral territory. The relative strength index ( RSI) reads 52, the Stochastic reads 61, the commodity channel index (CCI) reads 63, and the average directional index (ADX) reads 24, all neutral.
Three indicators tilt bullish: the Awesome oscillator (AO) sits at 1,308, the momentum indicator (MOM) sits at 1,664 and the moving average convergence divergence ( MACD) level reads 118. The split between neutral and bullish oscillator readings mirrors the price chart itself, a market building energy inside a range rather than trending hard in either direction.
Moving Averages Send Mixed Signals
Moving averages (MAs) send a mixed message depending on the timeframe. Short-term averages favor buyers: the 10-period exponential moving average (EMA) sits at $63,712, the 10-period simple moving average (SMA) sits at $63,835, and the 20-period, 30-period, and 50-period SMAs all read bullish as well.

Longer-term averages tell a different story. The 50-period EMA at $64,954, the 100-period EMA at $68,200, the 100-period SMA at $70,363, the 200-period EMA at $74,189, and the 200-period SMA at $73,158 all sit above the current price, marking overhead resistance that could cap rallies until bitcoin closes above those levels on sustained volume.
Bull Verdict:
Bitcoin’s short-term structure still favors buyers. The 4-hour and daily charts both show higher lows holding since the rebound from $57,735, and three momentum readings, the AO, the MOM, and the MACD oscillators, all point bullish. Short-term moving averages from the 10-period to the 50-period Simple SMA sit below the current price and support the uptrend. A close above $64,500 on rising volume would confirm continuation toward $65,500 and open a path to $67,000.
Bear Verdict:
Longer-term resistance still looms overhead. The 100-period and 200-period EMAs sit as high as $74,189, well above the current $63,969 price, and the 100-period and 200-period SMAs read bearish as well. Daily volume has moderated rather than expanded, a sign that buyers have not committed to a breakout. A break below $63,600 would open a retest of $63,000, and losing $62,000 would weaken the broader recovery structure built since late June.
Bull Verdict:
Bitcoin’s short-term structure still favors buyers. The 4-hour and daily charts both show higher lows holding since the rebound from $57,735, and three momentum readings, the AO, the MOM, and the MACD oscillators, all point bullish. Short-term moving averages from the 10-period to the 50-period Simple SMA sit below the current price and support the uptrend. A close above $64,500 on rising volume would confirm continuation toward $65,500 and open a path to $67,000.
Bear Verdict:
Longer-term resistance still looms overhead. The 100-period and 200-period EMAs sit as high as $74,189, well above the current $63,969 price, and the 100-period and 200-period SMAs read bearish as well. Daily volume has moderated rather than expanded, a sign that buyers have not committed to a breakout. A break below $63,600 would open a retest of $63,000, and losing $62,000 would weaken the broader recovery structure built since late June.

GOOGLE HANGOUTS ( Email ): theseller.ti@gmail.com
Discord: theseller.ti
TI.com Telegram: t.me/T0rrentinvites
Telegram: @T0rrentinvites
GOOGLE HANGOUTS ( Email ) Purchase of a tracker: t0rrentinvites.com@gmail.com


 Return to Top