










 06-26-2026, 10:49


 I Am Watching You!





Ethereum faces renewed selling pressure: Can key support hold this time?

In the past 24 hours, the crypto market witnessed $1.42 billion in liquidations in the derivatives market. Ethereum [$ETH] accounted for $349.17 million, with $274.29 million worth of long positions facing liquidation.
The leading altcoin was testing the $1,550 price level that it had tested in the first week of June. The higher timeframe price trend was bearish, and Bitcoin [BTC] was trading below the $60k support level at the time of writing.
This strong price move was likely driven by a liquidation cascade. According to Glassnode data, the selling pressure could intensify.
Source: Glassnode
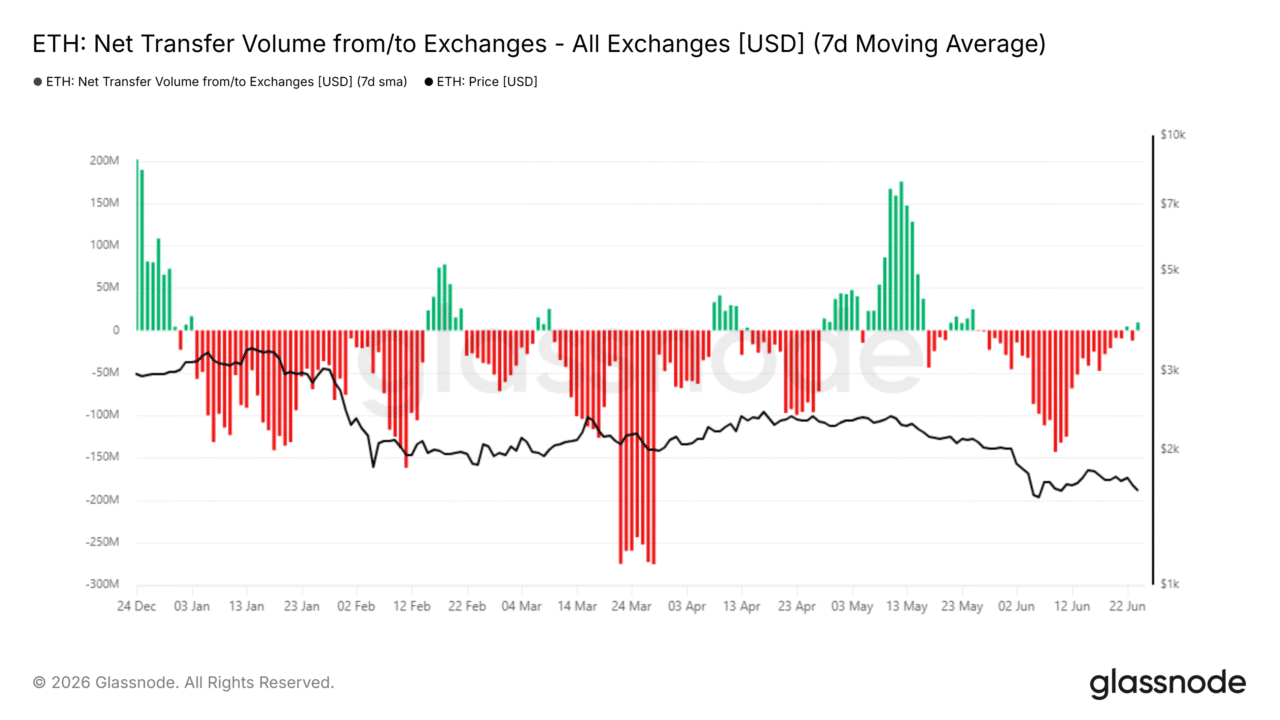
The 7-day moving average of the Ethereum net transfer to/from exchanges metric saw a positive shift. It had been negative over the past three weeks, signaling a flow of coins out of exchanges.
A shift toward net transfers into exchanges would mean more $ETH made available for selling. This could put greater pressure on the already-strained price action.
Source: Glassnode
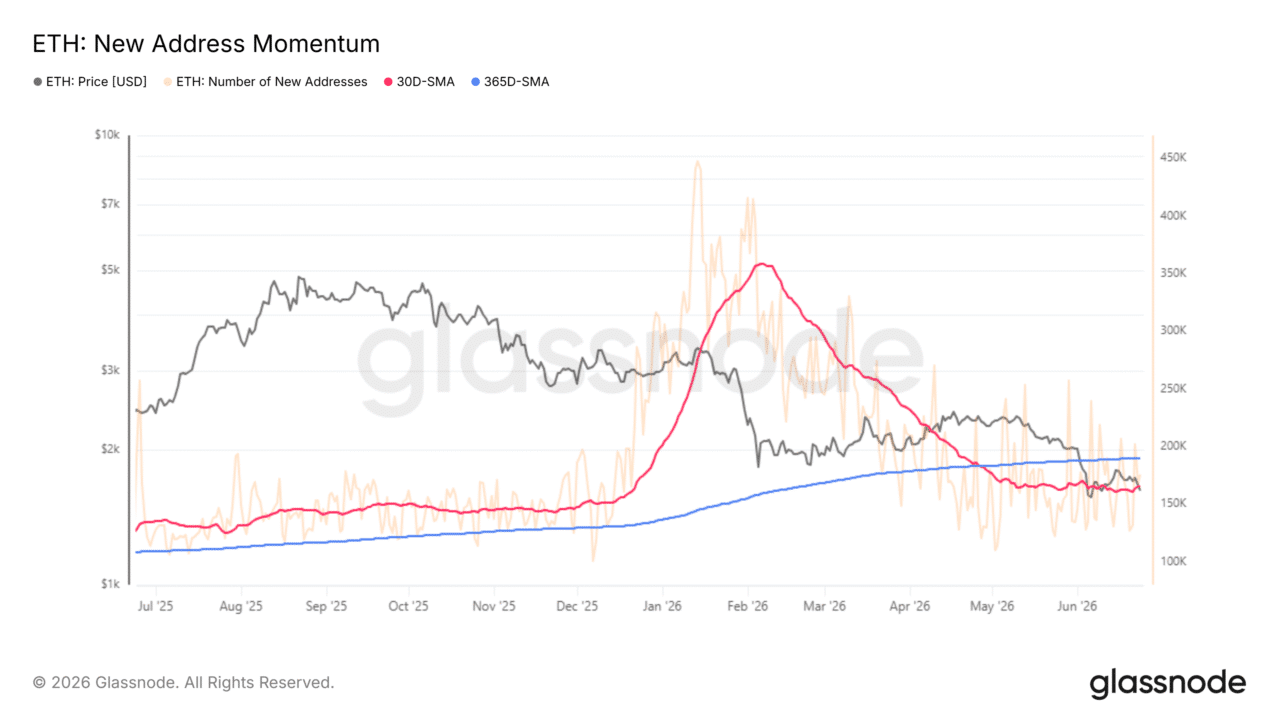
Another metric from Glassnode, the new address momentum, uses the averages of the monthly [red] and yearly [blue] new addresses to track network adoption.
Since late April, the monthly average of new addresses has fallen below the yearly average. This indicated a contraction in onchain activity and decreased adoption rates. Such a change is typical of deteriorating market sentiment and declining price trends.
The case for a bullish Ethereum inflection point around the corner
Source: CryptoQuant
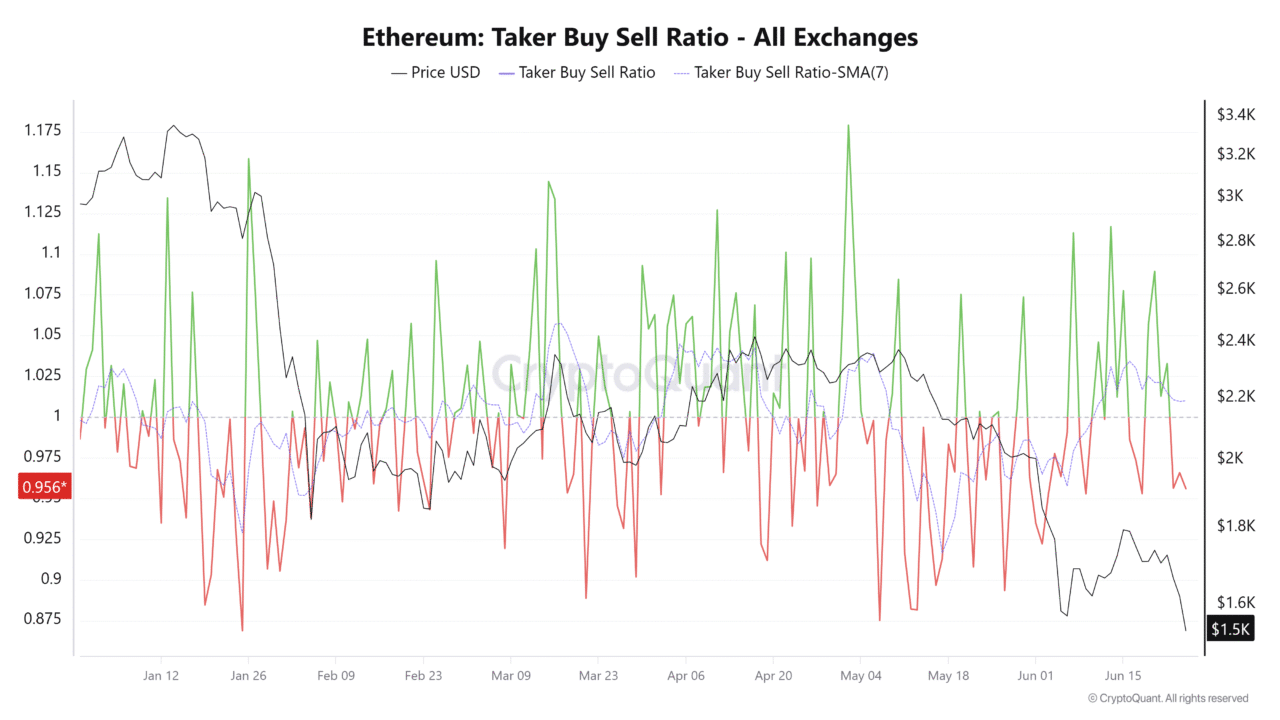
The 7-day moving average of the taker buy-sell ratio in the derivatives market has been in positive territory since June 10. However, the price bounce toward $1.8k made last week has quickly reversed.
The data showed speculative market participants were willing to buy the bid. These buyers also set up conditions for a squeeze, like the most recent one.
Source: CryptoQuant
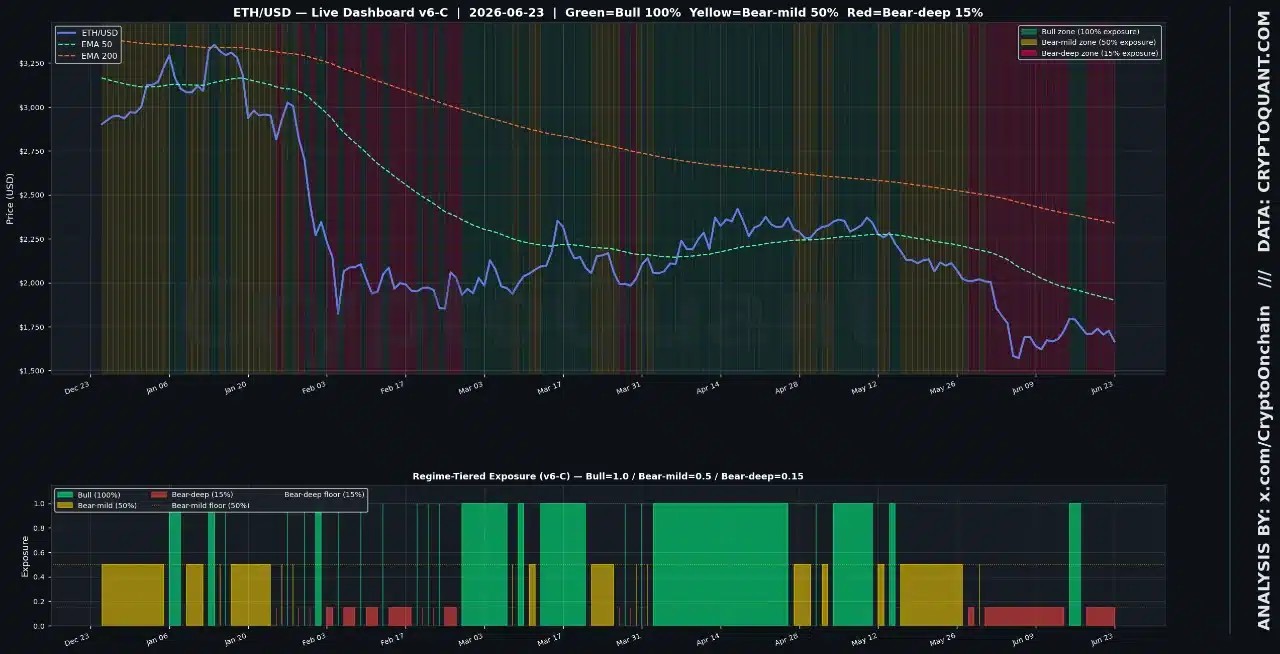
In a post on CryptoQuant Insights, analyst CryptoOnchain used a systematic regime model to demonstrate that a defensive stance among Ethereum market participants.
Using both Bitcoin’s derivatives flows and centralized exchanges’ stablecoin flows, the analyst’s assessment indicated a modest 45% probability of a bullish shift for $ETH.
In particular, the decisive shift toward stablecoin inflows to Binance can serve as a good indicator of returning investor risk appetite, the analyst concluded.
Until such a shift, patience would likely be a safer bet for investors than bullish or bearish conviction.

GOOGLE HANGOUTS ( Email ): theseller.ti@gmail.com
Discord: theseller.ti
TI.com Telegram: t.me/T0rrentinvites
Telegram: @T0rrentinvites
GOOGLE HANGOUTS ( Email ) Purchase of a tracker: t0rrentinvites.com@gmail.com


 Return to Top