










 07-12-2026, 11:21


 I Am Watching You!





Bitcoin Price Prediction: Key Support Could Trigger a Rebound to $65,600

Bitcoin is testing a key support area after failing to clear $64,671, with both charts pointing to a possible rebound if buyers defend the zone. Holding between roughly $62,163 and $63,500 could open the way toward $65,600, while a deeper break would put lower support back in focus.
Bitcoin Pullback Tests Key Support Before Next Move
Bitcoin turned lower after failing to break through the $64,671 resistance level, suggesting short-term momentum has weakened. The rejection does not fully invalidate the recovery, but it increases the chance of a deeper pullback before buyers try again.
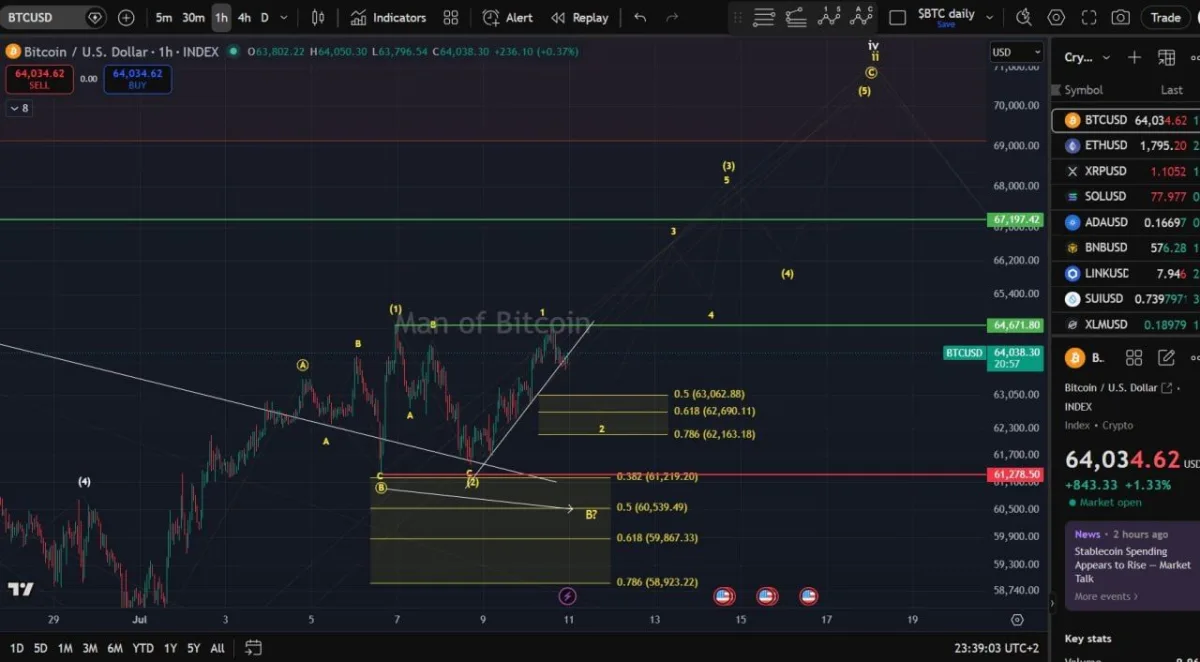
$BTC one-hour chart. Source: Man of Bitcoin/X
The chart identifies the move lower as a possible wave-two correction after Bitcoin climbed from the $61,278 area. The main support zone sits between $63,062 and $62,163, where several Fibonacci retracement levels overlap and could attract fresh demand.
A controlled reaction from this zone would keep the broader bullish structure intact and support another test of $64,671. A decisive break above that resistance could open the way toward $67,197, followed by the stronger barrier near $69,000.
However, the setup weakens if Bitcoin closes below $62,163 and fails to recover quickly. That would shift attention back to $61,278, while a deeper correction could expose the $60,539-$58,923 region.
Bitcoin Pullback Could Set Up a Run Toward $65,600
Bitcoin may first retest the $63,200-$63,500 support zone before attempting another move higher. The chart suggests that holding this area could preserve short-term bullish momentum and open the way toward $65,600.
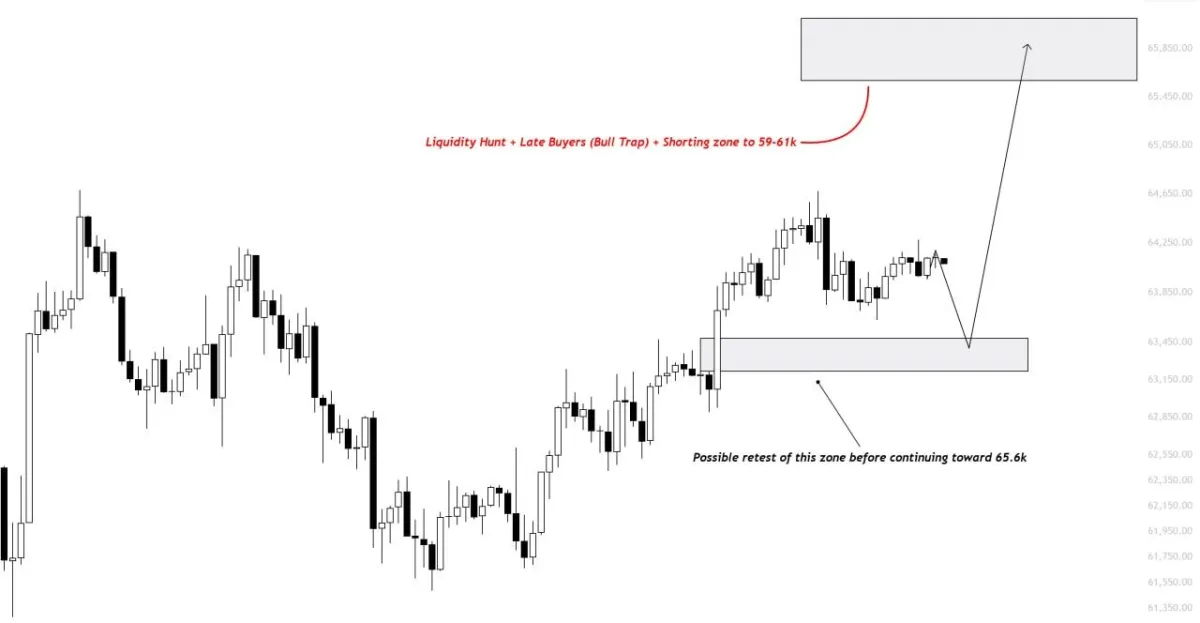
$BTC intraday chart. Source: Kaz/X
The marked support zone sits near the base of Bitcoin’s latest advance, making it an important area for buyers to defend. A controlled pullback followed by a strong reaction would suggest that the market is forming a higher low rather than beginning a deeper correction.
The upside target sits near $65,600, where liquidity and late buyers may gather above recent highs. That area could attract profit-taking and create a bull trap if Bitcoin breaks higher but fails to hold the move.
A clean loss of the $63,200 area would weaken the setup and increase the risk of a deeper decline. The chart points to the $59,000-$61,000 region as a possible downside target if the expected rebound fails.

GOOGLE HANGOUTS ( Email ): theseller.ti@gmail.com
Discord: theseller.ti
TI.com Telegram: t.me/T0rrentinvites
Telegram: @T0rrentinvites
GOOGLE HANGOUTS ( Email ) Purchase of a tracker: t0rrentinvites.com@gmail.com


 Return to Top