










 06-28-2026, 14:21


 I Am Watching You!





Bitcoin Price Prediction: $62,500 Bounce or Deeper BTC Crash?

Bitcoin is stuck between strong support at $58,000 and a major liquidity target near $62,500. A short-term move higher could come first, but analysts still warn that $BTC may need a deeper correction before finding a real cycle bottom.
Bitcoin Drawdown History Points to Deeper Bottom Risk
Bitcoin may need a deeper correction before forming a durable cycle bottom, according to one analyst comparing past $BTC bear-market declines.
Bitcoin Drawdown History Points to Deeper Bottom Risk
Bitcoin may need a deeper correction before forming a durable cycle bottom, according to one analyst comparing past $BTC bear-market declines.
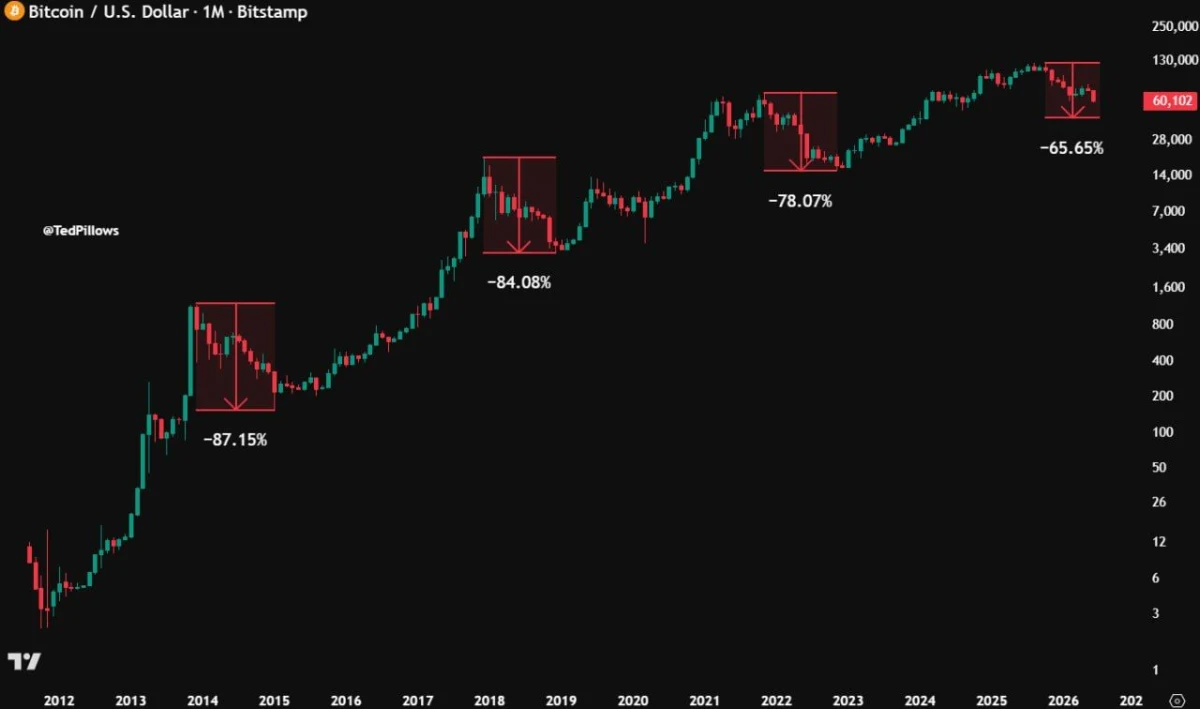
$BTC/USD Monthly Chart. Source: @TedPillows on X
The chart shows Bitcoin’s previous major cycle drawdowns, with $BTC falling 87.15% in 2015, 84.08% in 2018 and 78.07% in 2022. The current cycle correction is smaller by comparison, raising questions about whether the market has already reached a bottom.
Bitcoin is trading near $60,100 after pulling back from its latest cycle high. The analyst argues that a 50% decline may not be enough to mark a full bottom and expects a deeper 60%-65% drawdown before the next major low forms.
However, each cycle has shown smaller percentage declines than the last. If that pattern continues, Bitcoin may not need to match earlier bear-market crashes. A stronger recovery from current levels would weaken the deeper correction scenario.
Bitcoin Coils Between $58,000 Support and $62,500 Liquidity
Bitcoin is trading in a tight range as buyers defend the $58,000 area and liquidity builds near $62,500.
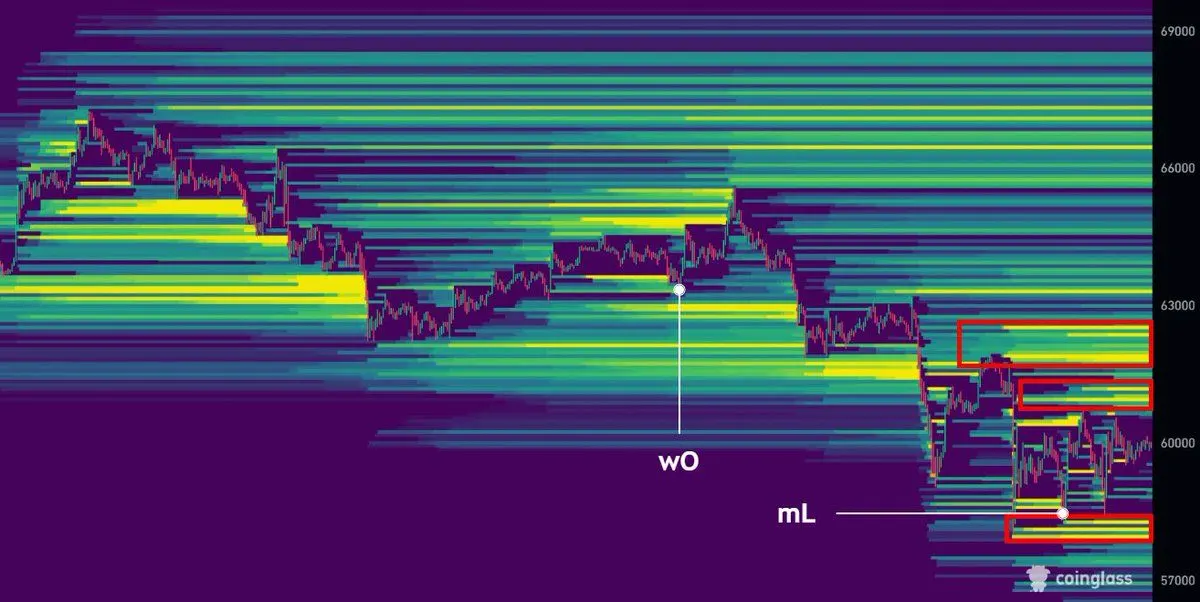
$BTC Liquidity Heatmap. Source: @XBTkaz on X
The chart shows $BTC moving sideways after several failed attempts to break below the $58,000 zone. According to the analyst, repeated downside failures suggest passive buyers are still active near that level.
The main upside target sits near $62,500, where the high-volume node and liquidity cluster are marked on the heatmap. A move into that zone could come first if Bitcoin continues to coil above support.
However, the analyst expects any upside liquidity sweep to be temporary. After taking out the $62,500 area, $BTC could turn lower again and retest the $56,000-$58,000 region.
For now, the key levels are clear: $58,000 remains the main support zone, while $62,500 is the next upside liquidity target.

GOOGLE HANGOUTS ( Email ): theseller.ti@gmail.com
Discord: theseller.ti
TI.com Telegram: t.me/T0rrentinvites
Telegram: @T0rrentinvites
GOOGLE HANGOUTS ( Email ) Purchase of a tracker: t0rrentinvites.com@gmail.com


 Return to Top