










 11-01-2026, 16:45


 I Am Watching You!





Ethereum whales withdraw $29M despite bearish signals – Will ETH recover?

Ethereum [$ETH] whales have intensified their accumulation activity despite broader market weakness, withdrawing millions in $ETH from exchanges. As per Lookonchain, two whale wallets received 13,002 $ETH, worth roughly $29.09 million, from FalconX and OKX.
Specifically, one whale received 9,625 $ETH worth nearly $21.57 million from FalconX, while a newly created wallet withdrew 3,377 $ETH worth approximately $7.52 million from OKX.
These significant $ETH withdrawals highlighted a growing interest among the large investors despite Ethereum’s recent price weakness.
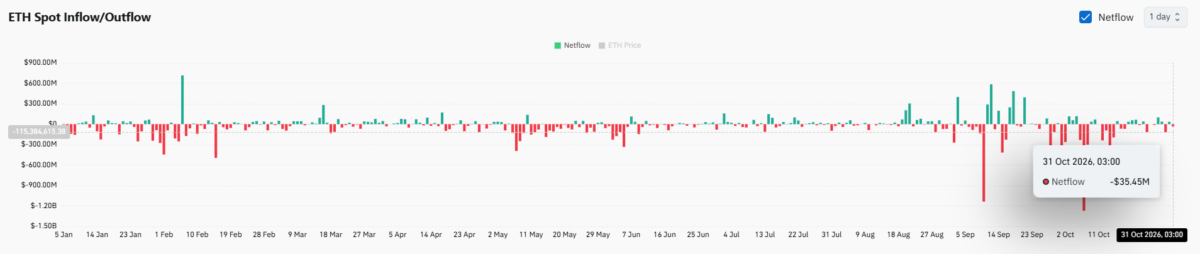
Beyond the reported whale transfers, Ethereum’s broader exchange activity revealed token withdrawals despite prevailing market uncertainty. At the time of reporting, $ETH had recorded around -$35.45 million in Spot Netflow, according to CoinGlass data.
The negative reading implied withdrawals exceeded deposits, extending the broader trend of ongoing exchange outflows. The latest reading notably followed several considerable withdrawal spikes throughout October, an activity that could reduce immediately available selling supply.
However, these outflows are yet to translate into a meaningful price recovery, leaving Ethereum vulnerable to further declines.
Specifically, one whale received 9,625 $ETH worth nearly $21.57 million from FalconX, while a newly created wallet withdrew 3,377 $ETH worth approximately $7.52 million from OKX.
These significant $ETH withdrawals highlighted a growing interest among the large investors despite Ethereum’s recent price weakness.
Beyond the reported whale transfers, Ethereum’s broader exchange activity revealed token withdrawals despite prevailing market uncertainty. At the time of reporting, $ETH had recorded around -$35.45 million in Spot Netflow, according to CoinGlass data.
The negative reading implied withdrawals exceeded deposits, extending the broader trend of ongoing exchange outflows. The latest reading notably followed several considerable withdrawal spikes throughout October, an activity that could reduce immediately available selling supply.
However, these outflows are yet to translate into a meaningful price recovery, leaving Ethereum vulnerable to further declines.
Source: $ETH Spot Netflow on CoinGlass
Why are Ethereum traders turning increasingly bearish?
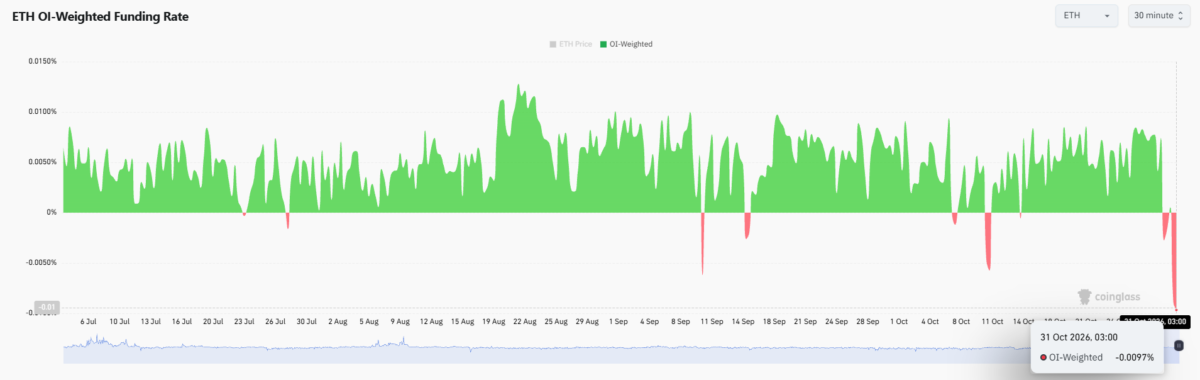
Contrastingly, while the Spot exchange withdrawals suggested potential accumulation, Ethereum’s derivatives market, on the other hand, reflected an opposite shift in trader positioning. CoinGlass highlighted that $ETH’s OI-Weighted Funding Rate rapidly declined to -0.0097% as of writing.
Notably, the decline marked a sharp reversal from the predominantly positive funding rates recorded throughout the month of October. The reversal meant that the short traders paid long traders, highlighting growing demand for bearish exposure across leveraged positions.
Furthermore, the decline also suggested that the market participants highly anticipated further downside despite substantial whale withdrawals.
However, it is worth noting that the negative funding alone could not validate additional losses, particularly in case renewed buying triggers short liquidations.
Why are Ethereum traders turning increasingly bearish?
Contrastingly, while the Spot exchange withdrawals suggested potential accumulation, Ethereum’s derivatives market, on the other hand, reflected an opposite shift in trader positioning. CoinGlass highlighted that $ETH’s OI-Weighted Funding Rate rapidly declined to -0.0097% as of writing.
Notably, the decline marked a sharp reversal from the predominantly positive funding rates recorded throughout the month of October. The reversal meant that the short traders paid long traders, highlighting growing demand for bearish exposure across leveraged positions.
Furthermore, the decline also suggested that the market participants highly anticipated further downside despite substantial whale withdrawals.
However, it is worth noting that the negative funding alone could not validate additional losses, particularly in case renewed buying triggers short liquidations.
Source: $ETH OI-Weighted Funding Rate on CoinGlass
Could $2,200 support spark $ETH’s next rebound?
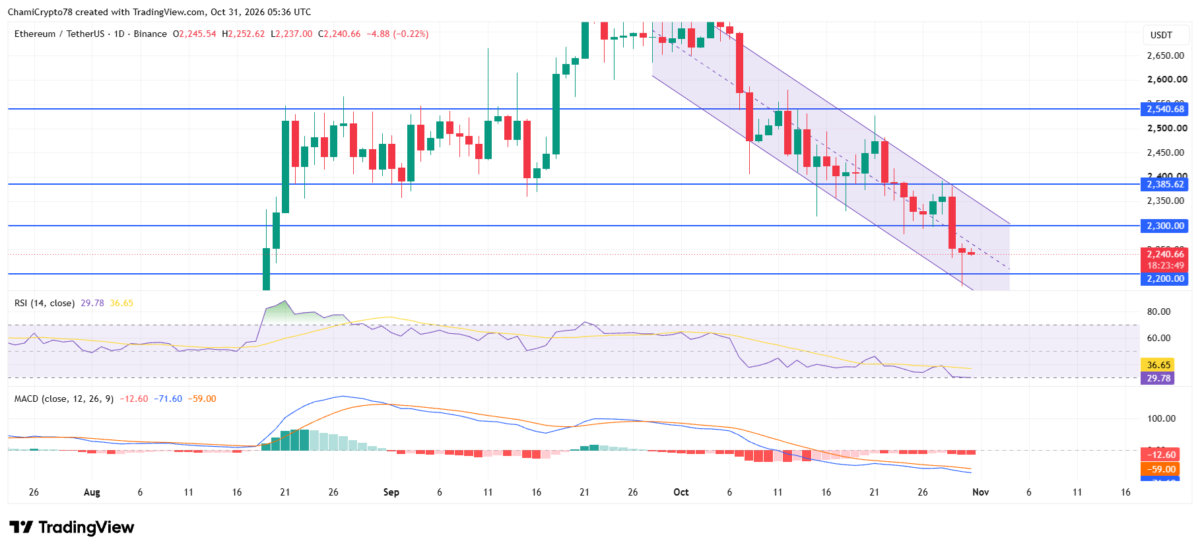
Ethereum’s daily chart structure highlighted a persistent bearish pressure as the token traded around $2,240 at press time, within a descending channel.
Notably, the bears had already pushed Ethereum beneath the $2,300 price level, weakening its previous support structure. More importantly, the price subsequently approached the $2,200 potential support, where buyers faced another crucial test.
The RSI indicator, meanwhile, dropped to 29.78 into oversold territory, implying intense selling pressure. Additionally, the MACD indicator also maintained a bearish outlook below its signal line with its negative histogram confirming that sellers continued controlling the broader trend.
Could $2,200 support spark $ETH’s next rebound?
Ethereum’s daily chart structure highlighted a persistent bearish pressure as the token traded around $2,240 at press time, within a descending channel.
Notably, the bears had already pushed Ethereum beneath the $2,300 price level, weakening its previous support structure. More importantly, the price subsequently approached the $2,200 potential support, where buyers faced another crucial test.
The RSI indicator, meanwhile, dropped to 29.78 into oversold territory, implying intense selling pressure. Additionally, the MACD indicator also maintained a bearish outlook below its signal line with its negative histogram confirming that sellers continued controlling the broader trend.
Source: $ETH/USDT Chart on TradingView
Ultimately, Ethereum’s $29.09 million whale accumulation and persistent exchange outflows offered potential recovery signals, but the prevailing bearish conditions continued limiting immediate recovery attempts.
For a sustained price rebound, buyers would need to defend the $2,200 support and reclaim the $2,300 price level.
Ultimately, Ethereum’s $29.09 million whale accumulation and persistent exchange outflows offered potential recovery signals, but the prevailing bearish conditions continued limiting immediate recovery attempts.
For a sustained price rebound, buyers would need to defend the $2,200 support and reclaim the $2,300 price level.

GOOGLE HANGOUTS ( Email ): theseller.ti@gmail.com
Discord: theseller.ti
TI.com Telegram: t.me/T0rrentinvites
Telegram: @T0rrentinvites
GOOGLE HANGOUTS ( Email ) Purchase of a tracker: t0rrentinvites.com@gmail.com


 Return to Top