










 06-26-2026, 10:34


 I Am Watching You!





Dogecoin Price Prediction: Will $0.073 Support Hold for DOGE?

Dogecoin has slipped below $0.075 as heavy selling pushes price toward critical support near $0.073. Holding this level could spark a rebound toward $0.080, but a clean break may open the door to a much sharper decline.
Dogecoin Breaks Below $0.075 as Selling Volume Surges
Dogecoin has fallen below the $0.075 level during a broader crypto market sell-off, with rising volume confirming strong short-term selling pressure.
The 30-minute chart shows $DOGE trading near $0.0748 after dropping more than 5%. Price first lost the $0.080 support level and then moved sideways below it before sellers triggered another sharp decline.
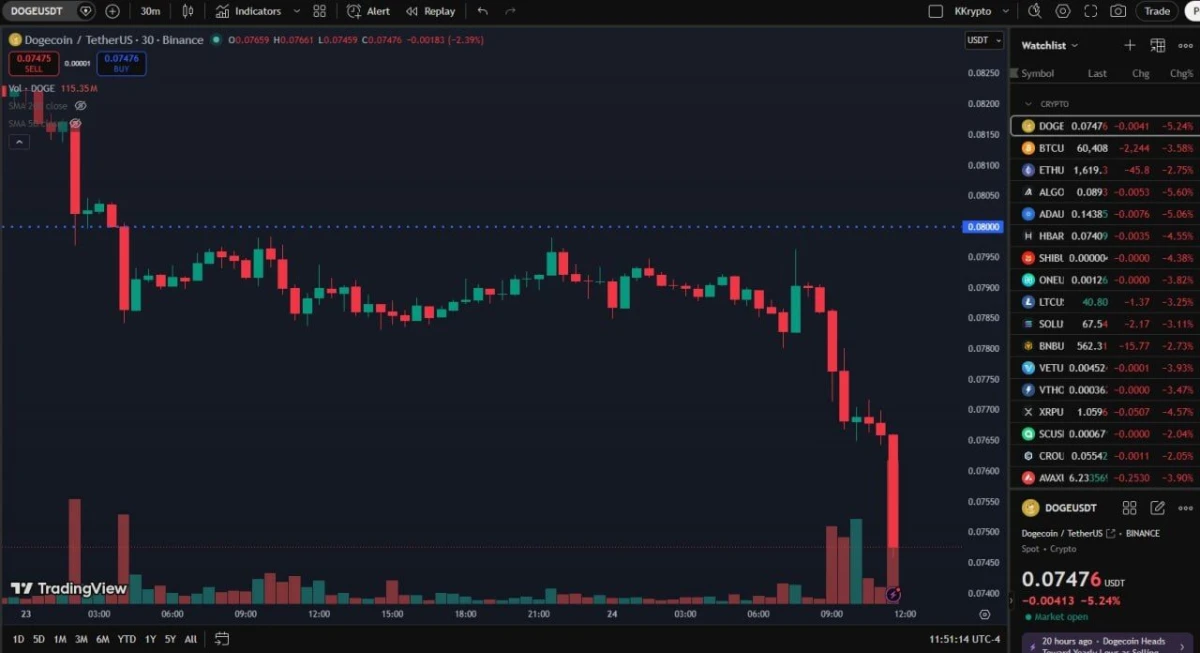
$DOGE/$USDT 30-Minute Price and Volume Chart. Source: KrissPax (@krisspax) on X
The latest red candle came with one of the largest volume spikes on the chart, suggesting that the breakdown was driven by active selling rather than a low-volume drift. $DOGE is also forming lower highs and lower lows, keeping the short-term structure bearish.
If Dogecoin remains below $0.075, sellers could test the nearby $0.074 area. Continued weakness may expose lower support levels that are not visible on this short-term chart.
However, a quick recovery above $0.075 could reduce immediate pressure. $DOGE would then need to reclaim the $0.078–$0.080 region to show that buyers are regaining control.
For now, the volume-backed breakdown favors sellers, while $0.075 has become the first level bulls need to recover.
Dogecoin Tests $0.074 Support as a Breakdown Could Open a Price Void
Dogecoin is attempting to hold a major historical support area after a sharp sell-off pushed price close to its January 2024 wick.
The four-hour chart shows $DOGE trading near $0.0753 after briefly falling toward $0.0741. This zone is now the main level separating a possible recovery from another leg lower.
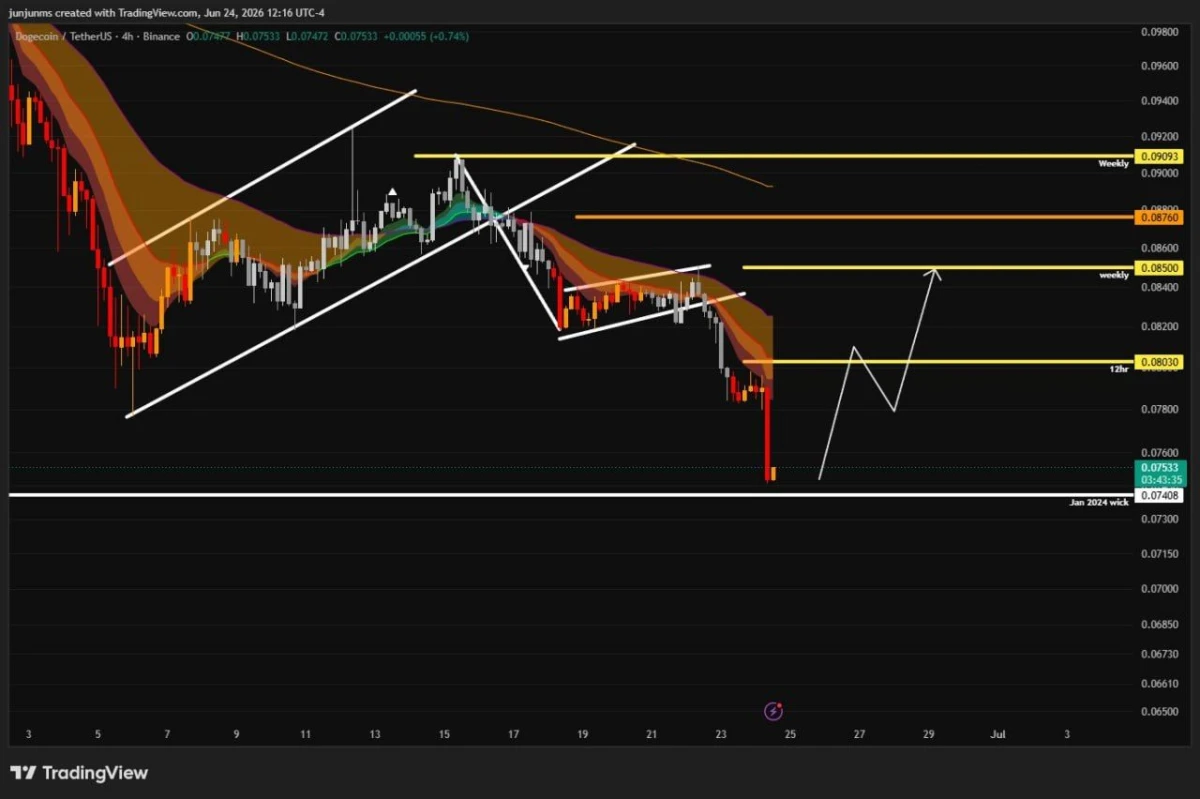
$DOGE/$USDT Four-Hour Support and Resistance Chart. Source: Carlos Garcia Tapia (@CAGThe3rd) on
Carlos Garcia Tapia warns of a “void” below $0.073. This means the chart shows limited nearby support beneath that level, so a confirmed breakdown could allow the decline to accelerate before buyers find a stronger area to defend.
However, holding above $0.074 could support a relief bounce. $DOGE would first need to reclaim the 12-hour resistance near $0.0803. A stronger recovery could then target the weekly level around $0.085, followed by resistance at $0.0876 and $0.0909.
The wider trend remains bearish because Dogecoin continues to trade below the descending resistance band. Therefore, any initial rebound would remain a relief move unless $DOGE recovers above the $0.0803–$0.085 region.
For now, $0.074 is the critical support. A confirmed move below $0.073 would increase the risk of a faster decline, while reclaiming $0.0803 could give buyers room to attempt a broader recovery.

GOOGLE HANGOUTS ( Email ): theseller.ti@gmail.com
Discord: theseller.ti
TI.com Telegram: t.me/T0rrentinvites
Telegram: @T0rrentinvites
GOOGLE HANGOUTS ( Email ) Purchase of a tracker: t0rrentinvites.com@gmail.com


 Return to Top